->->MC_ENG_DESKTOP/MC_ENG_NEWS/MC_ENG_MARKETS_AS/MC_ENG_ROS_NWS_MKTS_AS_ATF_728
Advertisement


Dear Reader,
Global markets, particularly the US, are gripped by a wave of anxiety as stubborn inflation persists and bond yields remain elevated. On Friday, US stocks plummeted after Treasury yields surged, triggered by unexpectedly strong job data that stoked fears of delayed interest rate cuts by the Federal Reserve. Analysts now predict that the Fed will maintain high interest rates for longer than traders had anticipated. This trend is not confined to the US; bond yields in the UK and Japan have also reached multi-year highs.
In India, the stock market closed in the red for four of five trading days last week, suffering a 2.38% decline—the worst performance in two months. The downturn could have been more severe if not for a robust showing from IT companies following TCS's results. Mid and small-cap stocks were particularly hard hit, losing approximately 6% over the week.
Foreign Institutional Investors (FIIs) continued their exodus from Indian markets, offloading equities worth ₹16,854.25 crore during the week, which brings January's total FII outflow to ₹21,357.46 crore.
Sector-wise, the Power index fell nearly 9%, while the Realty index dropped over 7%. The PSU index also declined by 7%, with both Capital Goods and Metal stocks losing around 5%. Despite this bleak scenario, Domestic Institutional Investors (DIIs) stepped in to buy equities worth ₹21,682.76 crore.
The Indian markets have yet to react to Friday's sharp declines in the US, and further selling is anticipated, especially following remarks from Federal Reserve Governor Michelle Bowman highlighting that inflation remains "uncomfortably above" the Fed's long-term target of 2%. On that same day, the benchmark 10-year US Treasury yield reached its highest intraday level since November 2023.
The STOXX Europe 600 Index gained 0.65% in Europe as investors expect the European Central Bank (ECB) to cut interest rates in January despite rising inflation concerns. Italy's FTSE climbed 2.82%, while Germany's DAX and France's CAC rose by 1.55% and 2.04%, respectively. The UK's FTSE managed a modest increase of 0.30%, even as its government benchmark 10-year bond hit 4.8%, marking its highest level since August 2008.
Conversely, Japan's Nikkei 225 Index fell by 1.8% amid speculation regarding the timing of the Bank of Japan's next interest rate hike, with Japanese bond yields rising to their highest level since 2011 at 1.19%.
In China, stocks fell by 1.34%, with the Hang Seng dropping by a significant 3.52%. The Chinese economy is facing deflationary pressures, evidenced by a year-on-year decline of 2.3% in the producer price index—marking the continuation of deflation in factory gate prices for an unprecedented 27 months.
More room for decline
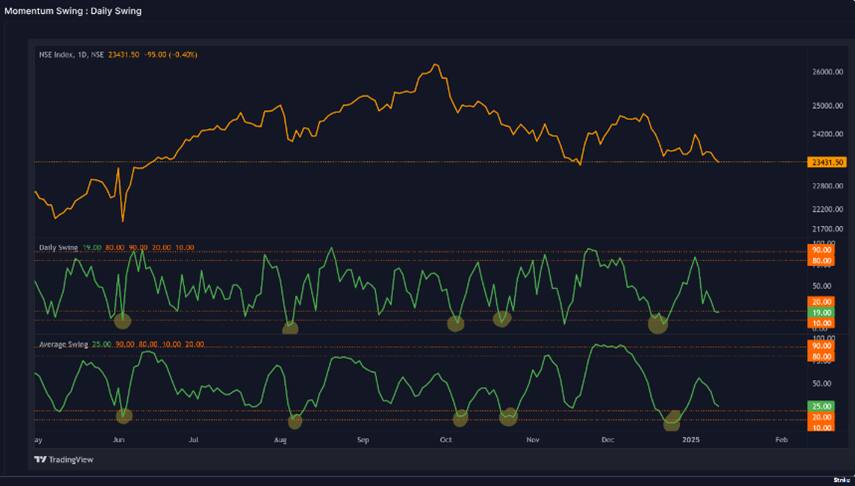
The Nifty index closed lower after two weeks of attempts to recover. It finished beneath the recent lows and broke below the 40-week moving average. Notably, all major indices—including Bank Nifty, Nifty Midcap 100, and Nifty Smallcap 100—also fell below their weekly averages.
The Weekly Momentum Indicator (RMI) has issued sell signals for both the midcap and smallcap indices, indicating a potential continuation of the decline in Indian equity markets for another 4 to 6 weeks. The prevailing trend shows a series of lower highs and lower lows. While the November low at 23,263 remains intact for now, it is at risk of being breached, especially since Bank Nifty has already dipped below this level this week.
Current oversold conditions in both daily and average swing indicators have historically marked significant turning points. The daily swing indicator is currently at 19, nearing oversold territory, while the average swing stands at 25, suggesting there is still room for further decline. It’s worth noting that since October, oversold readings have resulted in only minor bounces, so we cannot expect a swift recovery as we might in a bull market. Patience will be essential as we navigate these challenging market conditions.
Source: web.strike.money
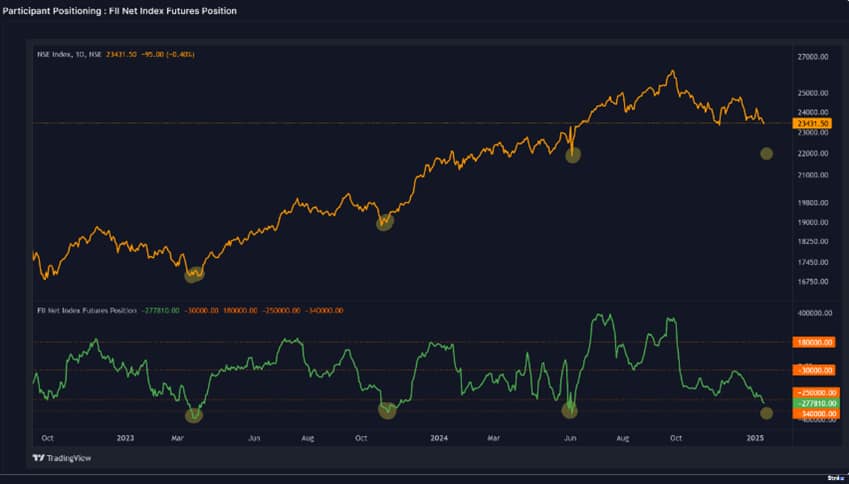
This week, several articles discussed the short positions held by Foreign Institutional Investors (FIIs) in the market. FIIs have been short since October 7, 2024, but their positions have fluctuated—going down, then up, and down again. While there has been a significant increase in short positions recently, they still fall short of the levels seen during the last three instances of market downturns. It may be prudent to wait for the market to become more oversold across various indicators before making any judgments.
Some analysts have pointed to the percentage of short positions, which is currently near the lower end of its historical range. However, the absolute number of contracts remains higher than previous lows. As of the end of this week, the reading stands at -277,810 contracts compared to -355,379 contracts on June 4, 2024, when election results were announced. For context, the figure was -392,756 contracts on March 22, 2023.
Source: web.strike.money
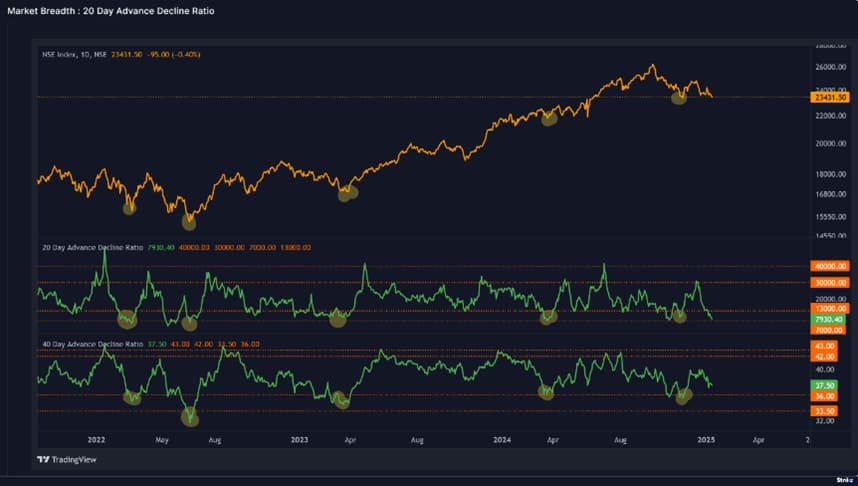
Just as we can combine swing readings, we can also analyze the 20-day and 40-day Advance-Decline (A/D) ratios together. When both indicators reach oversold levels, they often signal multi-week market bottoms.
Currently, the 20-day A/D ratio is below its threshold, while the 40-day A/D ratio still has considerable room to decline. It's important to note that midcap and smallcap stocks only began to drop this week. As the overall market decline intensifies, we can expect the 40-day A/D ratio to become oversold, potentially paving the way for the next lower bottom.
Source: web.strike.money
Sector Rotation
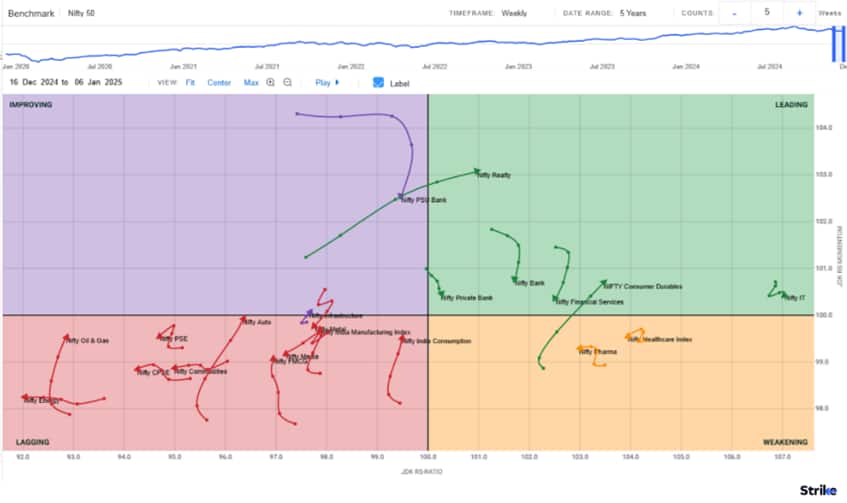
This week, the Nifty index closed 2.39% lower, slipping below its previous week's low to finish at 23,431.50. The banking sector was particularly hard hit, with the Nifty Private Bank, Nifty PSU Bank, and Nifty Bank indices losing momentum, all trending downward. In contrast, the Nifty Consumer Durables index remained stable after transitioning from a Weakening position to the Leading Quadrant last week.
We also observe that the Nifty Oil & Gas, Nifty Auto, and Nifty India Consumption indices are approaching the Improving Quadrant from Lagging, indicating potential turnarounds. Meanwhile, the Nifty Realty index maintains its momentum and outperforms the Leading Quadrant benchmark.
Source: web.strike.money
Weekly RRG
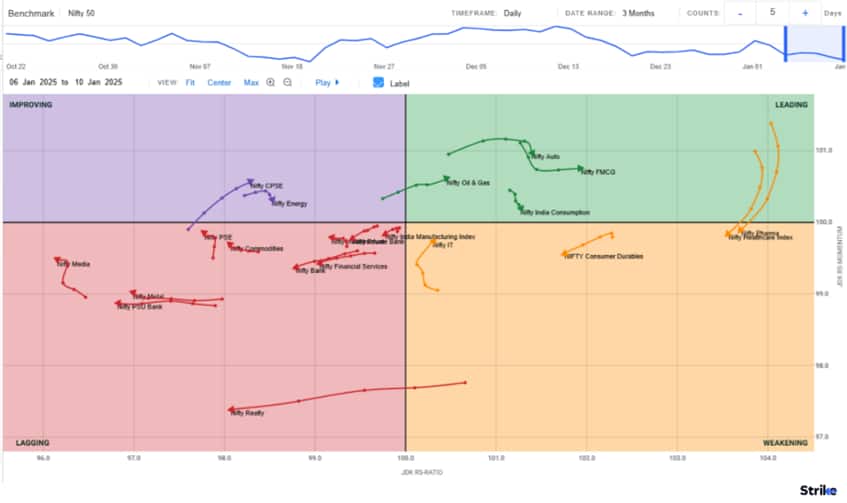
On the Daily Relative Rotation Graph (RRG), the Nifty IT index is poised to enter the Leading Quadrant directly from the Weakening Quadrant, suggesting that a minor correction in the index may soon conclude, potentially leading to a breakout above its resistance and a continuation of its upward trend.
In contrast, the Nifty Pharma and Nifty Healthcare indices have lost momentum, transitioning from the Leading Quadrant to Weakening. Whether these indices can reverse their trajectory or will move further into the Lagging Quadrant remains to be seen.
Additionally, the Nifty Oil & Gas index is currently positioned in the Leading Quadrant, which could help support the Nifty at its current levels.
Source: web.strike.money
Daily RRG
Stocks to watch
Among the stocks expected to perform better during the week are Infosys, Coromandel, SRF, M&M, and Dr Reddy’s Lab.
Among the stocks that can witness further weakness are IOC, IndusInd Bank, LIC, IDFC First Bank, LIC Housing Finance, Bank of Baroda, Asian Paints, Reliance, ACC and NTPC.
Cheers,
Shishir Asthana
 Ayodhya Ram Mandir Live Updates: Pran Pratistha ceremony set to dazzle with bells, flowers, and musical harmony Watch more
  Stock Market LIVE Updates: Sensex, Nifty trade flat; auto stocks in fast lane Watch more Plain Fintech - RBI MPC Analysis | Eyes still fixed on inflation, but who is bearing the cost? Watch more
 Find the best of Al News in one place, specially curated for you every weekend.
Stay on top of the latest tech trends and biggest startup news.